“
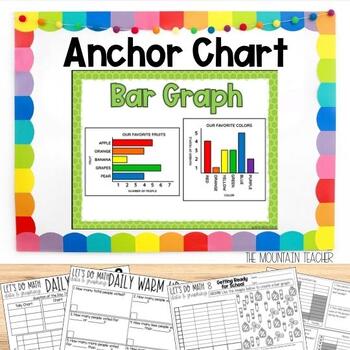
Need the perfect, ready-to-go bar graph questions with addition and subtraction activities? Grab these bar graphs activities for 1st, 2nd or 3rd grade students, including: bar graphs with addition and subtraction questions lesson plan, warm up, turn & talk, instructional video, anchor charts, learning target, and practice worksheet.
This includes ONE data and graphing activity that is a part of a bigger Data and Graphing Unit Bundle!
Bar Graph Skills Covered:
- Students will create bar graphs using data from the class or pre-selected data
- Students will look at a bar graph and answer questions based on the data on the graphs
- Students will look at bar graphs and answer addition and subtraction questions based on the data on the graphs
Formats Included:
- Printable (color & black and white)
- Google Slides
- TpT Easel
What’s Inside the Data & Graphing Activities:
- Lesson Plan
- Learning Target
- Anchor Chart
- Instructional Video (covers the anchor charts, warm up and turn and talk)
- Warm Up Activity
- Turn & Talk Activity
- Double Sided Worksheet
- Answer Key
- Link to Google Slides
How Long Will the Bar Graph Activities Take?
These bar graphs addition and subtraction questions activities are designed to fill one lesson period. They will take anywhere from 25-90 minutes.
What standards are covered in the Bar Graph Activities?
- 1.MD.C.4: Organize, represent, and interpret data with up to three categories; ask and answer questions about the total number of data points, how many in each category, and how many more or less are in one category than in another.
- 2.MD.D.10: Draw a picture graph and a bar graph (with single-unit scale) to represent a data set with up to four categories. Solve simple put-together, take-apart and compare problems using information presented in a bar graph.
- 3.MD.B.3: Draw a scaled picture graph and a scaled bar graph to represent a data set with several categories. Solve one- and two-step “how many more” and “how many less” problems using information presented in scaled bar graphs. For example, draw a bar graph in which each square in the bar graph might represent 5 pets.
When to Use the Data and Graphing Activities:
- Math Block – Whole Group or Small Group
- Homeschool Environment
- Guest Teachers
- Substitute Teachers
- Student Teachers
- Centers
- Enrichment
- Remediation
- Special Education Environments
Need more data and graphing lessons?
This lesson is part of a bigger unit – Data and Graphing Unit Bundle – which includes 15 days worth of lessons, assessments and more.
Get your plan time back and grab an entire year of math lessons!
“


